Inhalt
David Sooter | November 22, 2020 | Development
Debug Node.js cloud foundry application with VS Code
Debug now
We always try to keep your dev environments as similar as possible to our production environments to avoid unwanted side effects when deploying our app. Unfortunately it’s not always possible and that often leads to ours of deploying and redeploying your app trying to figure out why your app just isn’t working as expected. If you haven’t logged enough info from your app finding the issue can be very time consuming and nerve-racking.
Wouldn’t it be nice to be able to debug your app in the cloud and be able to see step by step why its behaving the way it is?
The blog attempts to show how just that can be done
I was inspired to write this blog after reading a blog post written by Marius Obert CloudFoundryFun #7 the goal being to connect your local vscode to your application running on cloud foundry.
I wanted to take it a step further and debug it in vscode.
But enough talk lets get started.
We will create a sample app deploy it and debug it in our local vscode.
Our super simple express app offers a single endpoint. /debug
Im not going to go into describing how to setup a minimal express server as its not the topic of this blog. But i will include all the coding used so you can follow a long.
package.json
{
  "name": "debug-cloud",
  "version": "1.0.0",
  "description": "",
  "main": "index.js",
  "engines": {
    "node": "12.X"
},
  "scripts": {
    "start": "node --inspect index.js",
    "test": "echo \"Error: no test specified\" [&][&] exit 1"
  },
  "author": "",
  "license": "ISC",
  "dependencies": {
    "express": "^4.17.1"
  }
}
One important note: your node version should be a version after v6.3.0 to be able to hande the node inspector on its own.
We also notice that we have added the inspect command to our start script this binds the debugger to the default port 9229 (you can of course change that)
"start": "node --inspect index.js"
So we have our config lets build the app
index.js
const express = require('express')
const app = express()
app.get('/debug', function(req, res){
    res.send("Debug endpoint called")
 });

// Start server
app.listen(process.env.PORT || 8080, ()=[gt]{})
Like i said our app only contains one endpoint but thats ok becase we are just trying to prove a point.
Ok we have our app set now lets deploy it. To do that define a manifest.yaml file
manifest.yaml
---
applications:
- name: debug-app
  memory: 128M
  random-route: true
  buildpacks:
    - nodejs_buildpack
After defining your manifest lets deploy our app
cf login #Perform you login to your cf account -- a demo account works as wellcf push #push your application
After your app has been pushed its time to enable ssh on your space and app
cf enable-ssh [lt]app-name[gt]
cf allow-space-ssh [lt]space-name[gt]
cf restage [lt]app-name[gt]
After enabling ssh, we have to restage the app for the changes to take effect if not you will get an unauthorized error
So now our work is done in the cloud lets get to debugging
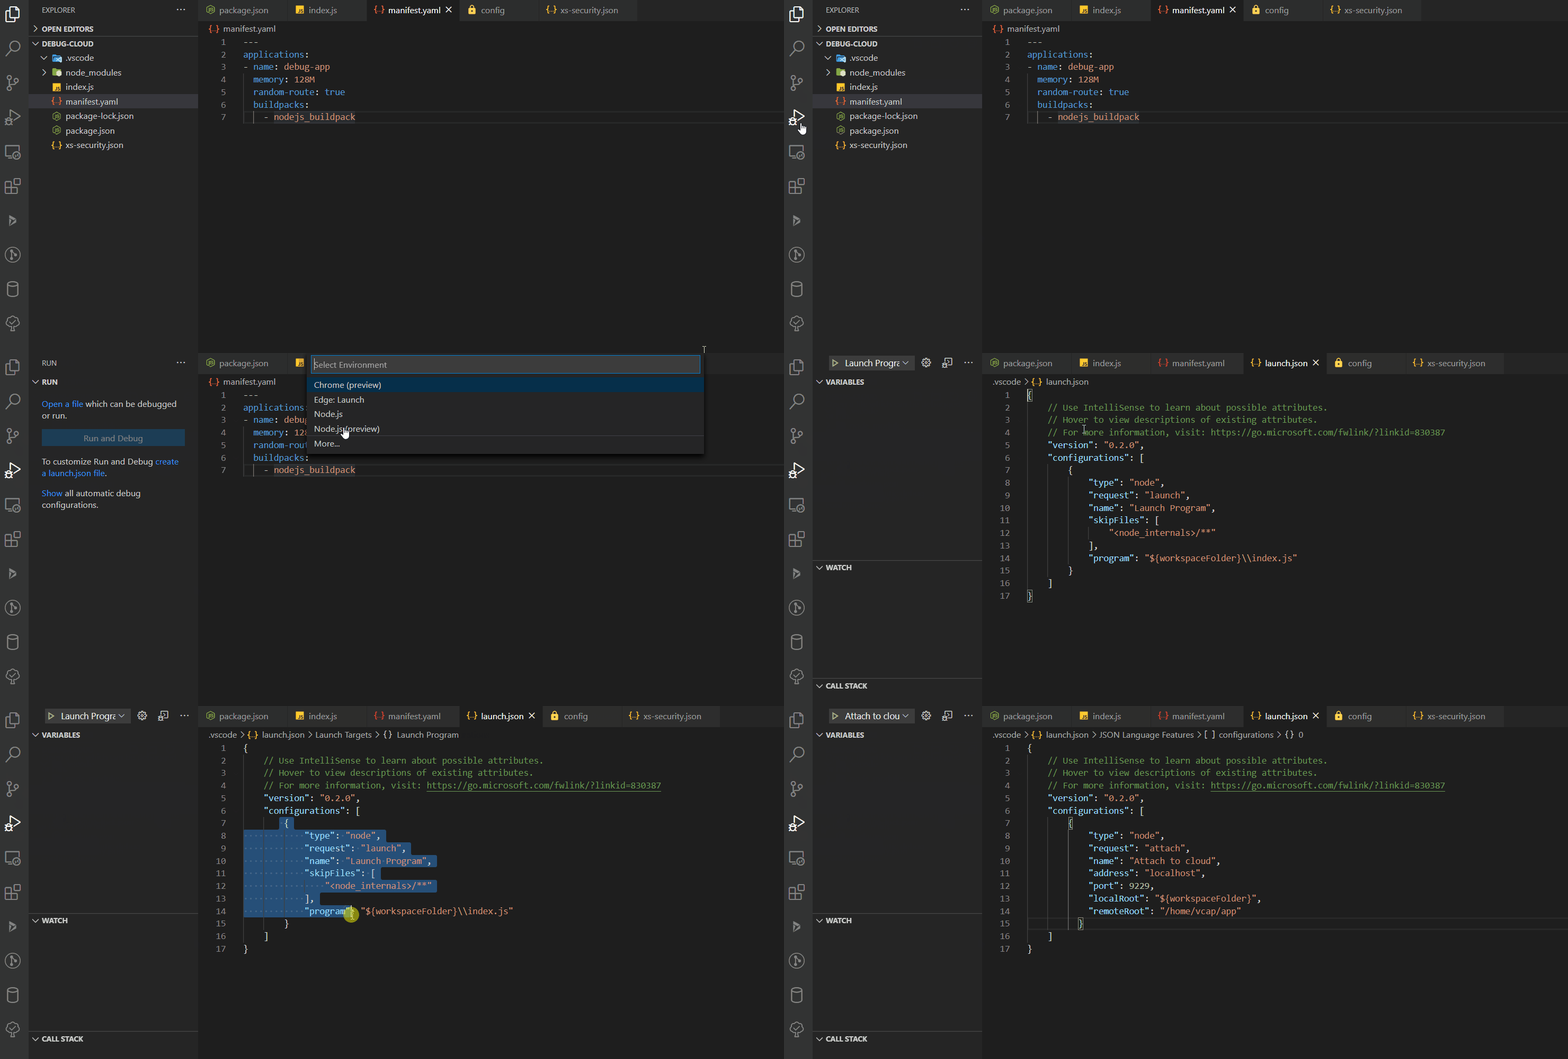
Open vscode and add the following to your launch config.
{
            "type": "node",
            "request": "attach",
            "name": "Attach cloud app ",
            "address": "localhost",
            "port": 9229,
            "localRoot": "${workspaceFolder}",
            "remoteRoot": "/home/vcap/app"
          }

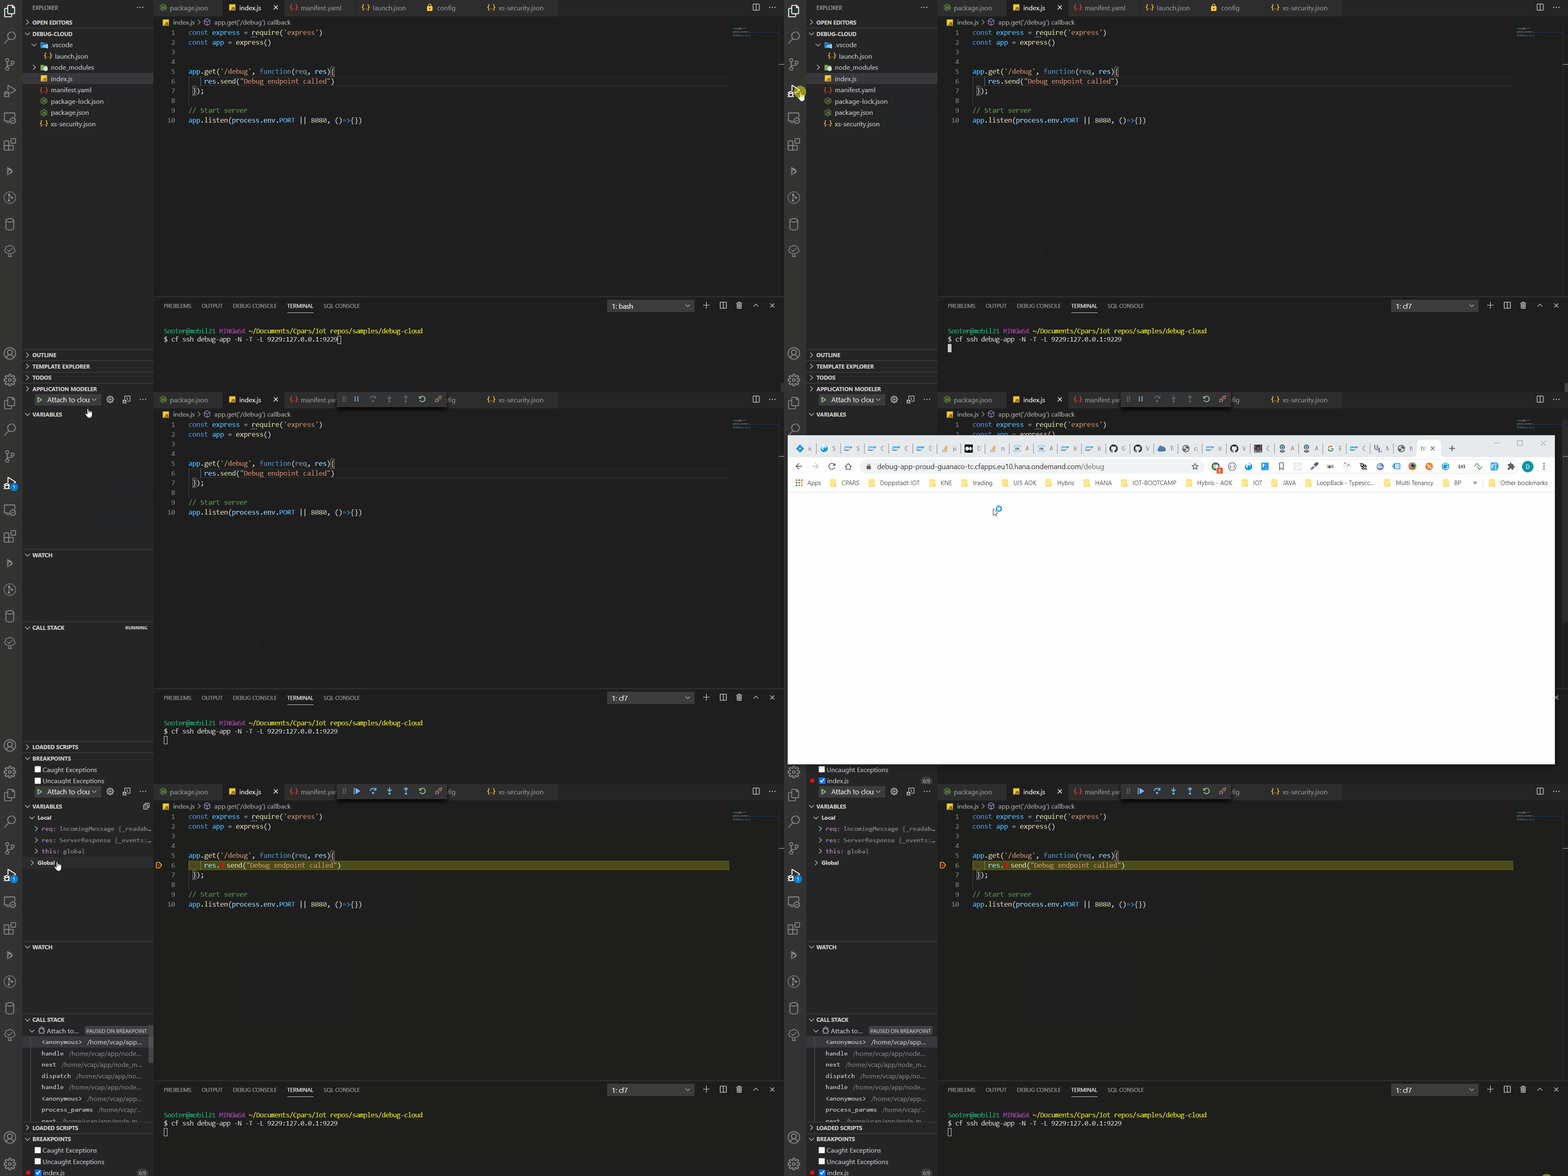
After adding the run config its time to bind our local port to our cloud application
Open and running the following
cf ssh [lt]APP_NAME[gt] -N -T -L 9229:127.0.0.1:9229
What that does is it bind the port 9229 of your remote server to the local port 9229
Now all we have to de is run the debugger and test our breakpoint
To get the our apps endpoint all we have to do is run cf apps to get a list off all out apps and their endpoints.
So lets try it all out.
As you can see after connecting via ssh we are able to debug our app locally isn’t that nice.

This isn’t meant for every day use but more as a way to find those hard to find issues when deploying your app to Cloud Foundry.
Enjoy and Happy debugging.
